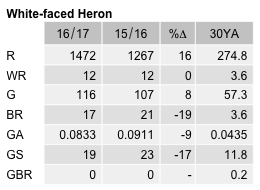
White-faced Heron
Egretta novaehollandiae
ABR description
The following is extracted from the Annual Bird Report for the twelve months to June 2017.
Common, breeding resident
Often seen on water margins of bodies of water of all sizes across the region.
General: The reporting rate (10.6%) is about the same as last year and the 10 & 30YAs. The reporting rate has wobbled around 10% since 1995. However, the number of birds sighted (3148) is 50% up on last year, and much higher than the 10YA (973) and 30YA (579). Records were from many sites scattered across 122 grid cells and throughout the year (winter 16%, spring 20%, summer 40%, autumn 24%). Max 49/22 Feb Wollogorang Lagoon (AnF1) with mean 2.1 and median 1. 17 breeding records: first nb/21 Aug Isabella Pond (HeS1), and last dy/18 Feb LGin W (AlB1).
GBS: 156 records from 19 sites spread across 13 grid cells, down on last year. Abundance is just below recent record highs (0.1 in 2015 bird year). Records were spread throughout the year (slightly lower in winter 15%) with max 9/1wk Feb Jerrabomberra (HaL2), mean 1.4, and median 1. Records were from 15 suburban and 4 rural sites, mostly near bodies of water. No breeding records this year, having been recorded in only 4 years since the start of the survey.
Abundance
Abundance is the average number of birds of that species per survey. Where the species was observed (presence recorded) but the number of birds seen was not recorded, this is treated as a count of zero.
Abundance by year
This chart shows the abundance of White-faced Heron between 1982 and 2017. 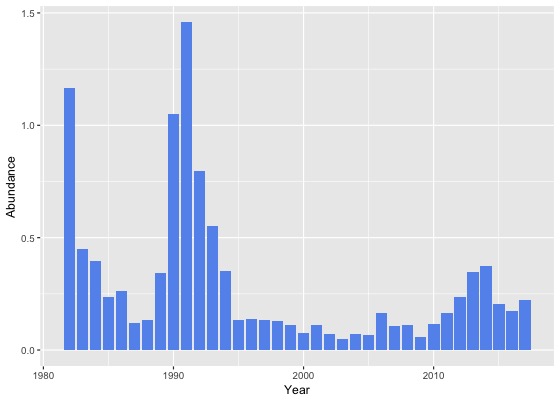
Abundance by month
This chart shows the monthly abundance of White-faced Heron. The blue lines show the abundance for the twelve months to June 2017 and the bars show the average abundance for the period 1982 to 2017. 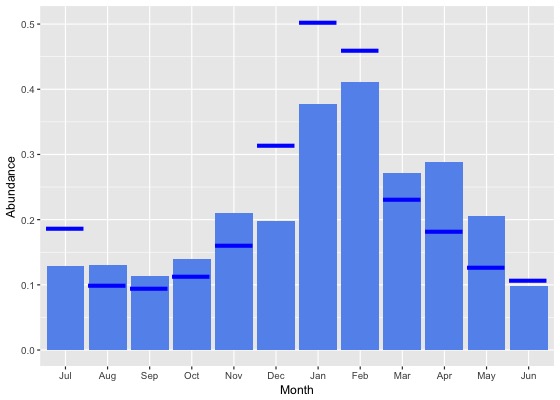
Abundance by season
This chart shows the seasonal abundance of White-faced Heron. The blue lines show the seasonal abundance for the twelve months to June 2017 and the bars show the average seasonal abundance for the period 1982 to 2017. 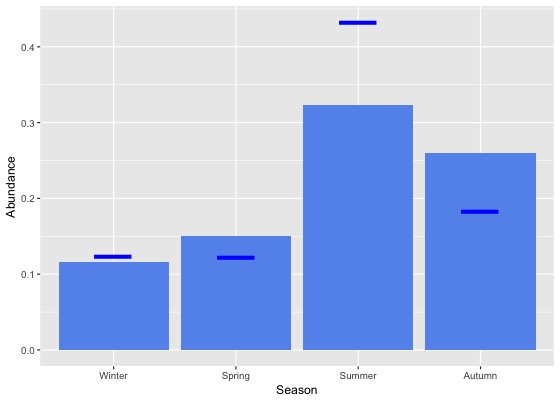
Abundance data
| Month | Season | ||||||||||||||||||
|---|---|---|---|---|---|---|---|---|---|---|---|---|---|---|---|---|---|---|---|
| Period | Jul | Aug | Sep | Oct | Nov | Dec | Jan | Feb | Mar | Apr | May | Jun | Winter | Spring | Summer | Autumn | All | ||
| All years | |||||||||||||||||||
| All | 0.1 | 0.1 | 0.1 | 0.1 | 0.2 | 0.2 | 0.4 | 0.4 | 0.3 | 0.3 | 0.2 | 0.1 | 0.1 | 0.2 | 0.3 | 0.3 | 0.2 | ||
| Previous years | |||||||||||||||||||
| All previous years | 0.1 | 0.1 | 0.1 | 0.1 | 0.2 | 0.2 | 0.4 | 0.4 | 0.3 | 0.3 | 0.2 | 0.1 | 0.1 | 0.2 | 0.3 | 0.3 | 0.2 | ||
| Previous 30 years | 0.1 | 0.1 | 0.1 | 0.1 | 0.2 | 0.2 | 0.4 | 0.4 | 0.3 | 0.3 | 0.2 | 0.1 | 0.1 | 0.2 | 0.3 | 0.3 | 0.2 | ||
| Previous 20 years | 0.1 | 0.1 | 0.1 | 0.1 | 0.2 | 0.2 | 0.3 | 0.3 | 0.2 | 0.2 | 0.2 | 0.1 | 0.1 | 0.1 | 0.2 | 0.2 | 0.2 | ||
| 10 year groups | |||||||||||||||||||
| [2007,2017) | 0.1 | 0.2 | 0.1 | 0.1 | 0.3 | 0.2 | 0.3 | 0.3 | 0.3 | 0.3 | 0.2 | 0.1 | 0.1 | 0.2 | 0.3 | 0.2 | 0.2 | ||
| [1997,2007) | 0.0 | 0.1 | 0.1 | 0.1 | 0.1 | 0.1 | 0.2 | 0.2 | 0.1 | 0.1 | 0.1 | 0.0 | 0.0 | 0.1 | 0.1 | 0.1 | 0.1 | ||
| [1987,1997) | 0.2 | 0.1 | 0.2 | 0.2 | 0.3 | 0.3 | 0.8 | 0.9 | 0.6 | 0.8 | 0.4 | 0.2 | 0.2 | 0.2 | 0.7 | 0.6 | 0.4 | ||
| 5 year groups | |||||||||||||||||||
| [2012,2017) | 0.2 | 0.2 | 0.2 | 0.2 | 0.3 | 0.2 | 0.3 | 0.3 | 0.3 | 0.3 | 0.2 | 0.1 | 0.2 | 0.2 | 0.3 | 0.3 | 0.2 | ||
| [2007,2012) | 0.0 | 0.1 | 0.1 | 0.1 | 0.1 | 0.1 | 0.2 | 0.3 | 0.1 | 0.2 | 0.1 | 0.0 | 0.0 | 0.1 | 0.2 | 0.2 | 0.1 | ||
| [2002,2007) | 0.0 | 0.0 | 0.0 | 0.1 | 0.1 | 0.1 | 0.2 | 0.2 | 0.1 | 0.1 | 0.1 | 0.0 | 0.0 | 0.1 | 0.1 | 0.1 | 0.1 | ||
| [1997,2002) | 0.0 | 0.1 | 0.1 | 0.1 | 0.1 | 0.1 | 0.2 | 0.2 | 0.2 | 0.1 | 0.1 | 0.0 | 0.0 | 0.1 | 0.2 | 0.1 | 0.1 | ||
| [1992,1997) | 0.3 | 0.1 | 0.3 | 0.3 | 0.4 | 0.2 | 0.7 | 0.8 | 0.6 | 0.5 | 0.2 | 0.1 | 0.1 | 0.3 | 0.5 | 0.4 | 0.4 | ||
| [1987,1992) | 0.1 | 0.1 | 0.1 | 0.2 | 0.2 | 0.3 | 0.8 | 1.0 | 0.6 | 0.9 | 0.5 | 0.2 | 0.2 | 0.2 | 0.7 | 0.7 | 0.4 | ||
| Year | |||||||||||||||||||
| 2017 | 0.2 | 0.1 | 0.1 | 0.1 | 0.2 | 0.3 | 0.5 | 0.5 | 0.2 | 0.2 | 0.1 | 0.1 | 0.1 | 0.1 | 0.4 | 0.2 | 0.2 | ||
| 2016 | 0.2 | 0.1 | 0.1 | 0.1 | 0.2 | 0.2 | 0.2 | 0.2 | 0.2 | 0.2 | 0.2 | 0.2 | 0.1 | 0.1 | 0.2 | 0.2 | 0.2 | ||
| 2015 | 0.3 | 0.3 | 0.1 | 0.2 | 0.2 | 0.2 | 0.2 | 0.2 | 0.3 | 0.2 | 0.2 | 0.1 | 0.2 | 0.2 | 0.2 | 0.2 | 0.2 | ||
| 2014 | 0.0 | 0.2 | 0.3 | 0.2 | 0.3 | 0.2 | 0.7 | 0.6 | 0.5 | 0.5 | 0.3 | 0.2 | 0.2 | 0.2 | 0.6 | 0.5 | 0.4 | ||
| 2013 | 0.2 | 0.2 | 0.1 | 0.2 | 0.6 | 0.3 | 0.5 | 0.6 | 0.4 | 0.4 | 0.4 | 0.1 | 0.2 | 0.3 | 0.4 | 0.4 | 0.3 | ||
| 2012 | 0.0 | 0.2 | 0.1 | 0.2 | 0.5 | 0.2 | 0.1 | 0.3 | 0.6 | 0.2 | 0.4 | 0.1 | 0.1 | 0.2 | 0.2 | 0.4 | 0.2 | ||
| 2011 | 0.1 | 0.1 | 0.1 | 0.1 | 0.2 | 0.1 | 0.3 | 0.6 | 0.1 | 0.3 | 0.1 | 0.0 | 0.1 | 0.1 | 0.3 | 0.2 | 0.2 | ||
| 2010 | 0.0 | 0.1 | 0.1 | 0.1 | 0.1 | 0.1 | 0.1 | 0.1 | 0.2 | 0.3 | 0.2 | 0.0 | 0.0 | 0.1 | 0.1 | 0.3 | 0.1 | ||
| 2009 | 0.1 | 0.1 | 0.1 | 0.0 | 0.0 | 0.0 | 0.2 | 0.1 | 0.1 | 0.1 | 0.1 | 0.0 | 0.0 | 0.0 | 0.1 | 0.1 | 0.1 | ||
| 2008 | 0.0 | 0.1 | 0.1 | 0.1 | 0.1 | 0.0 | 0.3 | 0.2 | 0.0 | 0.2 | 0.1 | 0.1 | 0.1 | 0.1 | 0.1 | 0.1 | 0.1 | ||
| 2007 | 0.1 | 0.0 | 0.0 | 0.1 | 0.2 | 0.1 | 0.1 | 0.3 | 0.1 | 0.1 | 0.1 | 0.0 | 0.0 | 0.1 | 0.1 | 0.1 | 0.1 | ||
| 2006 | 0.1 | 0.0 | 0.1 | 0.1 | 0.2 | 0.1 | 0.7 | 0.4 | 0.2 | 0.2 | 0.1 | 0.0 | 0.0 | 0.1 | 0.4 | 0.2 | 0.2 | ||
| 2005 | 0.1 | 0.1 | 0.0 | 0.1 | 0.1 | 0.1 | 0.1 | 0.1 | 0.1 | 0.1 | 0.1 | 0.0 | 0.0 | 0.1 | 0.1 | 0.1 | 0.1 | ||
| 2004 | 0.0 | 0.0 | 0.1 | 0.0 | 0.0 | 0.1 | 0.1 | 0.3 | 0.1 | 0.1 | 0.1 | 0.0 | 0.0 | 0.0 | 0.1 | 0.1 | 0.1 | ||
| 2003 | 0.1 | 0.0 | 0.0 | 0.0 | 0.1 | 0.0 | 0.0 | 0.0 | 0.1 | 0.1 | 0.0 | 0.0 | 0.0 | 0.0 | 0.0 | 0.1 | 0.0 | ||
| 2002 | 0.1 | 0.0 | 0.0 | 0.0 | 0.1 | 0.1 | 0.2 | 0.0 | 0.1 | 0.1 | 0.1 | 0.0 | 0.0 | 0.0 | 0.1 | 0.1 | 0.1 | ||
| 2001 | 0.0 | 0.1 | 0.0 | 0.1 | 0.1 | 0.1 | 0.2 | 0.1 | 0.3 | 0.1 | 0.1 | 0.0 | 0.0 | 0.1 | 0.1 | 0.2 | 0.1 | ||
| 2000 | 0.0 | 0.1 | 0.1 | 0.1 | 0.1 | 0.1 | 0.1 | 0.1 | 0.1 | 0.0 | 0.0 | 0.0 | 0.0 | 0.1 | 0.1 | 0.1 | 0.1 | ||
| 1999 | 0.1 | 0.2 | 0.1 | 0.1 | 0.0 | 0.2 | 0.2 | 0.3 | 0.1 | 0.0 | 0.1 | 0.1 | 0.1 | 0.0 | 0.2 | 0.1 | 0.1 | ||
| 1998 | 0.0 | 0.0 | 0.1 | 0.4 | 0.1 | 0.1 | 0.3 | 0.1 | 0.1 | 0.1 | 0.0 | 0.0 | 0.0 | 0.2 | 0.1 | 0.1 | 0.1 | ||
| 1997 | 0.0 | 0.1 | 0.1 | 0.2 | 0.1 | 0.5 | 0.2 | 0.3 | 0.1 | 0.0 | 0.1 | 0.0 | 0.1 | 0.1 | 0.3 | 0.1 | 0.1 | ||
| 1996 | 0.1 | 0.1 | 0.1 | 0.1 | 0.1 | 0.3 | 0.4 | 0.0 | 0.1 | 0.3 | 0.2 | 0.1 | 0.1 | 0.1 | 0.2 | 0.2 | 0.1 | ||
| 1995 | 0.2 | 0.0 | 0.0 | 0.1 | 0.1 | 0.2 | 0.2 | 0.2 | 0.3 | 0.1 | 0.1 | 0.0 | 0.1 | 0.1 | 0.2 | 0.2 | 0.1 | ||
| 1994 | 0.2 | 0.2 | 0.2 | 0.1 | 0.4 | 0.1 | 1.2 | 0.4 | 0.7 | 0.5 | 0.1 | 0.0 | 0.1 | 0.2 | 0.6 | 0.5 | 0.4 | ||
| 1993 | 0.1 | 0.3 | 0.2 | 0.4 | 0.4 | 0.1 | 0.4 | 3.1 | 0.7 | 1.5 | 0.4 | 0.1 | 0.2 | 0.3 | 1.0 | 0.8 | 0.6 | ||
| 1992 | 0.7 | 0.1 | 1.0 | 0.6 | 1.3 | 0.4 | 1.5 | 2.0 | 1.2 | 0.4 | 0.4 | 0.2 | 0.3 | 0.9 | 1.2 | 0.7 | 0.8 | ||
| 1991 | 0.2 | 0.1 | 0.2 | 0.4 | 1.3 | 1.2 | 6.0 | 6.4 | 3.3 | 1.4 | 0.6 | 0.9 | 0.3 | 0.6 | 4.1 | 1.8 | 1.5 | ||
| 1990 | 0.2 | 0.2 | 0.1 | 0.5 | 0.1 | 0.7 | 2.5 | 3.7 | 1.0 | 4.5 | 1.7 | 0.3 | 0.2 | 0.2 | 2.3 | 2.4 | 1.0 | ||
| 1989 | 0.1 | 0.1 | 0.2 | 0.2 | 0.2 | 0.3 | 0.2 | 0.3 | 0.5 | 1.0 | 1.0 | 0.2 | 0.1 | 0.2 | 0.3 | 0.8 | 0.3 | ||
| 1988 | 0.1 | 0.1 | 0.1 | 0.1 | 0.1 | 0.1 | 0.1 | 0.2 | 0.2 | 0.2 | 0.1 | 0.1 | 0.1 | 0.1 | 0.1 | 0.2 | 0.1 | ||
| 1987 | 0.0 | 0.0 | 0.1 | 0.1 | 0.1 | 0.1 | 0.1 | 0.2 | 0.2 | 0.1 | 0.1 | 0.1 | 0.1 | 0.1 | 0.1 | 0.1 | 0.1 | ||
| 1986 | 0.0 | 0.1 | 0.2 | 0.2 | 0.3 | 0.2 | 0.4 | 0.4 | 0.2 | 0.7 | 0.2 | 0.1 | 0.1 | 0.2 | 0.3 | 0.4 | 0.3 | ||
| 1985 | 0.0 | 0.3 | 0.2 | 0.2 | 0.3 | 0.2 | 1.4 | 0.5 | 0.2 | 0.2 | 0.1 | 0.2 | 0.2 | 0.2 | 0.4 | 0.2 | 0.2 | ||
| 1984 | 0.2 | 0.3 | 0.0 | 0.2 | 0.5 | 0.6 | 0.0 | 1.0 | 0.1 | 0.9 | 0.1 | 0.3 | 0.3 | 0.2 | 0.5 | 0.4 | 0.4 | ||
| 1983 | 0.2 | 0.2 | 0.2 | 0.4 | 0.4 | 0.6 | 0.2 | 0.9 | 0.0 | - | 0.4 | 0.6 | 0.4 | 0.4 | 0.6 | 0.4 | 0.5 | ||
| 1982 | - | 0.5 | - | 0.0 | 0.2 | 1.2 | - | 2.7 | - | 1.4 | - | 0.8 | 0.7 | 0.2 | 1.9 | 1.4 | 1.2 | ||
Reporting rates
Reporting rate is the proportion of all surveys in which the species was present.
Reporting rate by year
This chart shows the reporting rate of White-faced Heron each year between 1982 and 2017. 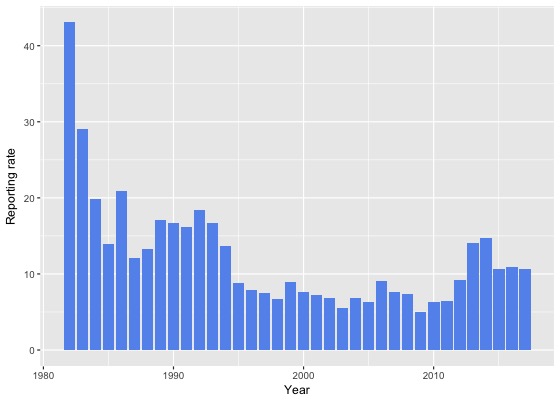
Reporting rate by month
This chart shows the reporting rate by month of White-faced Heron. The blue lines show the reporting rate for the twelve months to June 2017 and the bars show the average reporting rate for the period 1982 to 2017. 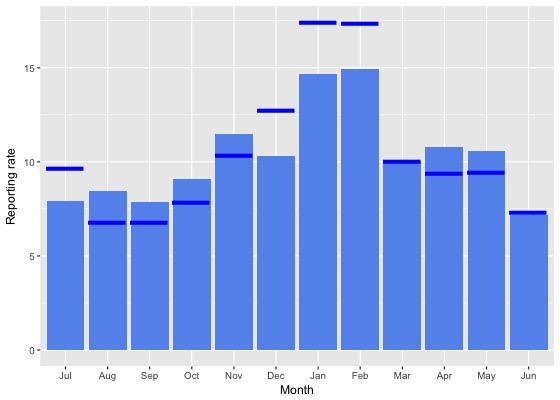
Reporting rate by season
This chart shows the seasonal reporting rate of White-faced Heron. The blue lines show the seasonal reporting rate for the twelve months to June 2017 and the bars show the average seasonal reporting rate for the period 1982 to 2017. 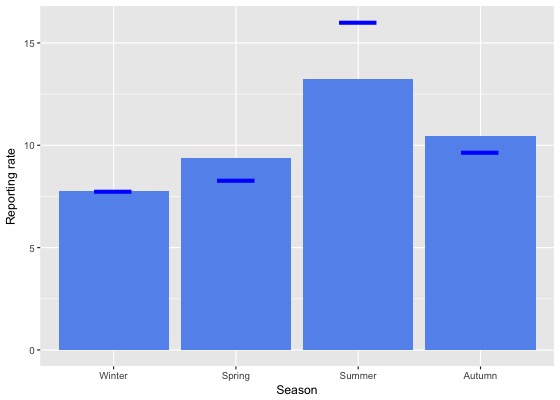
Reporting rate data
| Month | Season | ||||||||||||||||||
|---|---|---|---|---|---|---|---|---|---|---|---|---|---|---|---|---|---|---|---|
| Period | Jul | Aug | Sep | Oct | Nov | Dec | Jan | Feb | Mar | Apr | May | Jun | Winter | Spring | Summer | Autumn | All | ||
| All years | |||||||||||||||||||
| All | 7.9 | 8.5 | 7.9 | 9.1 | 11.5 | 10.3 | 14.7 | 14.9 | 10.0 | 10.8 | 10.6 | 7.2 | 7.8 | 9.4 | 13.2 | 10.4 | 10.3 | ||
| Previous years | |||||||||||||||||||
| All previous years | 7.6 | 8.8 | 8.0 | 9.3 | 11.6 | 9.9 | 14.2 | 14.4 | 10.0 | 11.0 | 10.8 | 7.1 | 7.8 | 9.5 | 12.7 | 10.6 | 10.2 | ||
| Previous 30 years | 7.7 | 8.6 | 8.0 | 9.2 | 11.5 | 9.7 | 14.1 | 13.9 | 10.0 | 10.6 | 10.7 | 6.9 | 7.6 | 9.5 | 12.5 | 10.4 | 10.1 | ||
| Previous 20 years | 6.9 | 7.9 | 7.0 | 8.5 | 11.0 | 8.9 | 14.0 | 12.7 | 8.8 | 9.1 | 10.4 | 6.0 | 6.8 | 8.7 | 11.8 | 9.3 | 9.3 | ||
| 10 year groups | |||||||||||||||||||
| [2007,2017) | 8.1 | 9.0 | 8.0 | 8.9 | 12.4 | 10.0 | 14.4 | 13.4 | 9.1 | 9.7 | 11.3 | 7.3 | 8.0 | 9.4 | 12.7 | 9.9 | 10.1 | ||
| [1997,2007) | 4.8 | 5.6 | 5.0 | 7.4 | 8.2 | 6.8 | 12.6 | 10.9 | 8.0 | 7.5 | 8.3 | 3.4 | 4.4 | 6.8 | 9.6 | 7.9 | 7.3 | ||
| [1987,1997) | 10.5 | 10.7 | 13.0 | 13.3 | 13.0 | 14.3 | 14.9 | 19.5 | 17.1 | 18.1 | 11.8 | 11.1 | 10.8 | 13.1 | 16.1 | 15.8 | 13.9 | ||
| 5 year groups | |||||||||||||||||||
| [2012,2017) | 8.8 | 9.4 | 9.1 | 10.5 | 13.8 | 12.3 | 15.1 | 14.1 | 10.5 | 11.6 | 12.0 | 9.5 | 9.3 | 10.9 | 14.0 | 11.3 | 11.6 | ||
| [2007,2012) | 5.9 | 7.5 | 5.5 | 6.1 | 8.5 | 5.0 | 12.0 | 10.2 | 5.4 | 5.2 | 9.2 | 3.1 | 4.8 | 6.4 | 8.6 | 6.2 | 6.5 | ||
| [2002,2007) | 4.9 | 4.0 | 4.1 | 6.9 | 7.6 | 5.8 | 13.5 | 10.8 | 8.3 | 9.0 | 8.1 | 2.8 | 3.8 | 6.1 | 9.3 | 8.5 | 7.0 | ||
| [1997,2002) | 4.5 | 7.4 | 6.2 | 8.2 | 8.9 | 8.0 | 11.6 | 11.0 | 7.6 | 5.8 | 8.7 | 4.3 | 5.3 | 7.6 | 10.0 | 7.2 | 7.7 | ||
| [1992,1997) | 12.3 | 7.6 | 12.0 | 11.4 | 13.8 | 10.3 | 14.6 | 15.8 | 15.2 | 16.7 | 12.8 | 6.5 | 8.6 | 12.4 | 13.5 | 15.0 | 12.4 | ||
| [1987,1992) | 9.7 | 12.3 | 13.4 | 14.4 | 12.7 | 16.1 | 15.1 | 21.0 | 18.2 | 18.9 | 11.4 | 13.8 | 11.9 | 13.5 | 17.4 | 16.2 | 14.7 | ||
| Year | |||||||||||||||||||
| 2017 | 9.7 | 6.8 | 6.8 | 7.9 | 10.4 | 12.8 | 17.4 | 17.3 | 10.1 | 9.4 | 9.4 | 7.3 | 7.7 | 8.3 | 16.0 | 9.7 | 10.6 | ||
| 2016 | 9.2 | 7.1 | 9.0 | 11.2 | 12.4 | 11.4 | 11.8 | 12.1 | 10.6 | 11.7 | 11.3 | 11.5 | 9.2 | 10.8 | 11.8 | 11.2 | 10.9 | ||
| 2015 | 11.0 | 14.1 | 8.6 | 10.1 | 12.7 | 12.0 | 10.9 | 12.2 | 9.9 | 9.7 | 11.2 | 7.7 | 10.3 | 10.4 | 11.7 | 10.2 | 10.7 | ||
| 2014 | 6.1 | 8.4 | 11.4 | 9.1 | 12.6 | 15.2 | 25.4 | 18.6 | 12.1 | 17.6 | 14.3 | 13.3 | 10.3 | 10.5 | 21.3 | 14.5 | 14.7 | ||
| 2013 | 10.5 | 9.5 | 10.3 | 12.2 | 21.8 | 14.9 | 21.3 | 18.2 | 11.3 | 13.3 | 12.1 | 6.1 | 8.5 | 14.3 | 18.0 | 12.2 | 14.0 | ||
| 2012 | 4.7 | 9.1 | 6.6 | 9.5 | 11.5 | 8.9 | 10.1 | 16.1 | 7.7 | 7.2 | 14.4 | 7.8 | 7.3 | 9.2 | 10.8 | 8.9 | 9.2 | ||
| 2011 | 6.5 | 6.4 | 5.8 | 6.5 | 7.9 | 4.2 | 11.8 | 9.6 | 3.8 | 6.3 | 7.6 | 3.2 | 4.6 | 6.5 | 8.4 | 5.8 | 6.5 | ||
| 2010 | 4.2 | 7.0 | 5.2 | 4.6 | 6.2 | 8.7 | 11.1 | 10.6 | 5.1 | 4.3 | 12.7 | 3.4 | 4.4 | 5.2 | 9.9 | 6.1 | 6.3 | ||
| 2009 | 5.8 | 9.4 | 6.0 | 3.1 | 4.5 | 1.1 | 12.7 | 6.7 | 6.0 | 4.1 | 9.2 | 0.9 | 4.2 | 4.2 | 6.3 | 5.9 | 5.0 | ||
| 2008 | 5.5 | 10.4 | 7.1 | 8.2 | 10.1 | 2.7 | 15.9 | 13.0 | 4.8 | 4.3 | 9.9 | 4.7 | 6.3 | 8.2 | 8.8 | 5.5 | 7.3 | ||
| 2007 | 7.7 | 4.6 | 3.3 | 7.9 | 16.9 | 6.7 | 10.6 | 12.2 | 7.7 | 7.3 | 8.9 | 3.3 | 4.3 | 8.2 | 9.1 | 7.8 | 7.6 | ||
| 2006 | 5.9 | 1.9 | 4.0 | 7.2 | 8.9 | 5.0 | 23.6 | 19.3 | 11.1 | 14.5 | 7.2 | 3.1 | 3.7 | 6.6 | 15.7 | 11.3 | 9.1 | ||
| 2005 | 5.1 | 6.5 | 2.2 | 7.2 | 7.6 | 4.4 | 7.1 | 10.9 | 8.7 | 6.6 | 12.4 | 2.3 | 4.0 | 5.0 | 6.4 | 9.3 | 6.3 | ||
| 2004 | 2.8 | 3.3 | 7.2 | 6.4 | 5.2 | 7.8 | 10.3 | 15.2 | 10.9 | 6.6 | 6.8 | 3.1 | 3.0 | 6.3 | 10.2 | 8.4 | 6.8 | ||
| 2003 | 6.0 | 2.2 | 4.7 | 4.7 | 8.3 | 5.5 | 5.9 | 5.5 | 5.4 | 8.3 | 4.7 | 3.1 | 3.6 | 5.9 | 5.6 | 6.3 | 5.5 | ||
| 2002 | 6.3 | 6.8 | 3.0 | 8.6 | 8.0 | 6.2 | 17.6 | 6.6 | 4.1 | 8.9 | 5.9 | 2.7 | 5.0 | 6.6 | 9.1 | 6.1 | 6.9 | ||
| 2001 | 3.1 | 6.6 | 4.7 | 8.0 | 14.2 | 7.6 | 11.0 | 9.8 | 6.6 | 7.8 | 7.5 | 3.0 | 4.0 | 8.0 | 9.3 | 7.2 | 7.2 | ||
| 2000 | 6.3 | 9.8 | 6.5 | 9.3 | 9.7 | 7.4 | 9.1 | 9.0 | 8.2 | 6.6 | 7.3 | 1.6 | 5.6 | 8.5 | 8.4 | 7.4 | 7.7 | ||
| 1999 | 8.8 | 8.2 | 6.3 | 7.5 | 5.8 | 11.9 | 14.6 | 16.4 | 7.6 | 4.1 | 10.8 | 7.5 | 7.8 | 6.6 | 14.2 | 7.4 | 8.9 | ||
| 1998 | 2.7 | 1.9 | 6.5 | 4.3 | 6.2 | 5.7 | 17.6 | 7.5 | 9.7 | 2.6 | 11.1 | 4.0 | 3.0 | 5.8 | 9.7 | 8.2 | 6.7 | ||
| 1997 | 4.6 | 6.9 | 9.1 | 11.8 | 6.0 | 7.7 | 9.8 | 12.3 | 7.5 | 4.6 | 6.7 | 5.6 | 5.5 | 8.6 | 9.4 | 5.7 | 7.5 | ||
| 1996 | 6.0 | 4.3 | 5.3 | 7.0 | 6.5 | 8.1 | 11.7 | 5.9 | 8.8 | 10.9 | 13.8 | 8.0 | 6.0 | 6.4 | 8.7 | 10.7 | 7.9 | ||
| 1995 | 9.7 | 2.3 | 1.9 | 9.1 | 8.2 | 10.3 | 13.3 | 12.7 | 17.3 | 10.5 | 7.8 | 4.3 | 5.1 | 6.9 | 12.2 | 12.0 | 8.8 | ||
| 1994 | 13.7 | 10.4 | 16.2 | 10.5 | 14.7 | 13.0 | 19.1 | 19.0 | 19.3 | 17.6 | 6.2 | 4.5 | 8.8 | 13.8 | 17.4 | 15.1 | 13.7 | ||
| 1993 | 10.2 | 20.5 | 12.9 | 18.7 | 21.2 | 8.7 | 18.4 | 34.4 | 11.1 | 28.3 | 15.6 | 7.2 | 13.3 | 17.7 | 18.9 | 17.4 | 16.7 | ||
| 1992 | 23.1 | 3.7 | 25.9 | 16.0 | 25.0 | 12.7 | 13.8 | 22.0 | 21.1 | 22.0 | 21.1 | 10.0 | 12.8 | 21.9 | 15.4 | 21.4 | 18.4 | ||
| 1991 | 6.3 | 7.4 | 10.5 | 11.7 | 19.6 | 14.9 | 26.8 | 24.0 | 22.2 | 32.2 | 18.0 | 24.0 | 10.0 | 14.0 | 21.1 | 24.0 | 16.2 | ||
| 1990 | 18.7 | 14.6 | 10.8 | 16.3 | 8.4 | 25.0 | 19.4 | 22.5 | 25.0 | 23.8 | 6.8 | 13.2 | 15.9 | 11.7 | 22.3 | 19.2 | 16.7 | ||
| 1989 | 6.6 | 13.4 | 16.2 | 20.8 | 15.7 | 21.7 | 19.1 | 23.7 | 18.9 | 19.0 | 13.8 | 14.9 | 11.6 | 17.8 | 21.6 | 17.5 | 17.1 | ||
| 1988 | 8.2 | 11.9 | 11.2 | 12.1 | 13.1 | 13.3 | 8.5 | 21.7 | 16.3 | 21.4 | 13.1 | 12.1 | 10.7 | 12.3 | 14.2 | 16.9 | 13.3 | ||
| 1987 | 9.1 | 6.7 | 14.6 | 10.5 | 9.9 | 10.0 | 12.8 | 17.1 | 15.3 | 11.9 | 7.9 | 12.3 | 11.7 | 11.5 | 13.5 | 11.6 | 12.1 | ||
| 1986 | 0.0 | 7.9 | 11.3 | 16.7 | 27.7 | 17.6 | 17.4 | 38.9 | 12.9 | 45.1 | 24.1 | 17.1 | 9.1 | 18.4 | 25.8 | 30.6 | 21.0 | ||
| 1985 | 3.3 | 20.0 | 13.5 | 8.1 | 10.5 | 8.3 | 75.0 | 41.2 | 18.2 | 10.5 | 20.0 | 21.4 | 14.8 | 10.3 | 21.2 | 15.0 | 14.0 | ||
| 1984 | 20.0 | 30.0 | 0.0 | 16.7 | 25.0 | 41.7 | 0.0 | 36.4 | 3.7 | 35.3 | 12.9 | 17.6 | 20.4 | 14.3 | 23.0 | 18.5 | 19.9 | ||
| 1983 | 16.7 | 25.0 | 20.0 | 23.1 | 33.3 | 38.5 | 16.7 | 63.6 | 0.0 | - | 16.7 | 27.3 | 24.1 | 25.9 | 43.3 | 14.3 | 29.0 | ||
| 1982 | - | 27.3 | - | 0.0 | 12.5 | 64.3 | - | 54.5 | - | 61.5 | - | 28.6 | 28.0 | 11.1 | 60.0 | 61.5 | 43.1 | ||
Breeding data
Breeding records by month
Number of breeding records by breeding code and month, 2017 and all years| Breeding code | Jul | Aug | Sep | Oct | Nov | Dec | Jan | Feb | Mar | Apr | May | Jun |
|---|---|---|---|---|---|---|---|---|---|---|---|---|
| 2017 | ||||||||||||
| Breeding (BLA code) | 0 | 0 | 0 | 0 | 0 | 0 | 0 | 0 | 0 | 0 | 0 | 0 |
| Carrying Food | 0 | 0 | 0 | 0 | 0 | 0 | 0 | 0 | 0 | 0 | 0 | 0 |
| Copulating | 0 | 0 | 0 | 0 | 0 | 0 | 0 | 0 | 0 | 0 | 0 | 0 |
| Display | 0 | 0 | 0 | 0 | 0 | 0 | 0 | 0 | 0 | 0 | 0 | 0 |
| Dependent young | 0 | 0 | 0 | 0 | 0 | 1 | 1 | 3 | 0 | 0 | 0 | 0 |
| Faecal sac | 0 | 0 | 0 | 0 | 0 | 0 | 0 | 0 | 0 | 0 | 0 | 0 |
| Inspecting hollow | 0 | 0 | 0 | 0 | 0 | 0 | 0 | 0 | 0 | 0 | 0 | 0 |
| Nest building | 0 | 2 | 1 | 0 | 0 | 2 | 2 | 0 | 0 | 0 | 0 | 0 |
| Nest with eggs | 0 | 0 | 0 | 0 | 0 | 0 | 0 | 0 | 0 | 0 | 0 | 0 |
| Nest with young | 0 | 0 | 0 | 0 | 0 | 1 | 0 | 0 | 0 | 0 | 0 | 0 |
| On/leaving nest | 0 | 0 | 0 | 0 | 1 | 1 | 2 | 0 | 0 | 0 | 0 | 0 |
| All years | ||||||||||||
| Breeding (BLA code) | 0 | 0 | 1 | 3 | 1 | 0 | 1 | 1 | 0 | 0 | 0 | 0 |
| Carrying Food | 0 | 0 | 0 | 0 | 1 | 0 | 0 | 0 | 0 | 0 | 0 | 0 |
| Copulating | 0 | 0 | 0 | 0 | 0 | 0 | 0 | 0 | 0 | 0 | 0 | 1 |
| Display | 0 | 0 | 0 | 0 | 0 | 0 | 0 | 0 | 0 | 0 | 0 | 0 |
| Dependent young | 0 | 0 | 0 | 1 | 6 | 1 | 9 | 6 | 1 | 0 | 0 | 0 |
| Faecal sac | 0 | 0 | 0 | 0 | 0 | 0 | 0 | 0 | 0 | 0 | 0 | 0 |
| Inspecting hollow | 0 | 0 | 0 | 0 | 0 | 0 | 0 | 0 | 0 | 0 | 0 | 0 |
| Nest building | 1 | 4 | 3 | 4 | 5 | 2 | 2 | 0 | 1 | 0 | 0 | 0 |
| Nest with eggs | 0 | 0 | 1 | 1 | 0 | 1 | 0 | 0 | 0 | 0 | 0 | 0 |
| Nest with young | 0 | 0 | 0 | 12 | 2 | 8 | 8 | 3 | 2 | 0 | 0 | 0 |
| On/leaving nest | 0 | 1 | 3 | 8 | 7 | 8 | 6 | 0 | 0 | 0 | 0 | 0 |
Breeding records by year
Average number of breeding records per period by breeding code| Period | Breeding (BLA code) | Carrying Food | Copulating | Display | Dependent young | Faecal sac | Inspecting hollow | Nest building | Nest with eggs | Nest with young | On/leaving nest |
|---|---|---|---|---|---|---|---|---|---|---|---|
| All years | |||||||||||
| All | 0.2 | 0.0 | 0.0 | 0.0 | 0.7 | 0.0 | 0.0 | 0.6 | 0.1 | 1.0 | 0.9 |
| Previous years | |||||||||||
| All previous years | 0.2 | 0.0 | 0.0 | 0.0 | 0.5 | 0.0 | 0.0 | 0.4 | 0.1 | 1.0 | 0.8 |
| Previous 30 years | 0.2 | 0.0 | 0.0 | 0.0 | 0.6 | 0.0 | 0.0 | 0.5 | 0.1 | 1.1 | 0.9 |
| Previous 20 years | 0.3 | 0.0 | 0.0 | 0.0 | 0.7 | 0.0 | 0.0 | 0.6 | 0.0 | 1.6 | 1.4 |
| 10 year groups | |||||||||||
| [2007,2017) | 0.3 | 0.1 | 0.1 | 0.0 | 0.9 | 0.0 | 0.0 | 1.0 | 0.1 | 2.7 | 1.7 |
| [1997,2007) | 0.4 | 0.0 | 0.0 | 0.0 | 0.5 | 0.0 | 0.0 | 0.2 | 0.0 | 0.4 | 1.1 |
| [1987,1997) | 0.0 | 0.0 | 0.0 | 0.0 | 0.4 | 0.0 | 0.0 | 0.3 | 0.2 | 0.3 | 0.0 |
| 5 year groups | |||||||||||
| [2012,2017) | 0.2 | 0.2 | 0.0 | 0.0 | 1.0 | 0.0 | 0.0 | 1.0 | 0.2 | 3.8 | 1.8 |
| [2007,2012) | 0.4 | 0.0 | 0.2 | 0.0 | 0.8 | 0.0 | 0.0 | 1.0 | 0.0 | 1.6 | 1.6 |
| [2002,2007) | 0.4 | 0.0 | 0.0 | 0.0 | 0.6 | 0.0 | 0.0 | 0.2 | 0.0 | 0.6 | 1.0 |
| [1997,2002) | 0.4 | 0.0 | 0.0 | 0.0 | 0.4 | 0.0 | 0.0 | 0.2 | 0.0 | 0.2 | 1.2 |
| [1992,1997) | 0.0 | 0.0 | 0.0 | 0.0 | 0.2 | 0.0 | 0.0 | 0.2 | 0.0 | 0.0 | 0.0 |
| [1987,1992) | 0.0 | 0.0 | 0.0 | 0.0 | 0.6 | 0.0 | 0.0 | 0.4 | 0.4 | 0.6 | 0.0 |
| Year | |||||||||||
| 2017 | 0.0 | 0.0 | 0.0 | 0.0 | 5.0 | 0.0 | 0.0 | 7.0 | 0.0 | 1.0 | 4.0 |
| 2016 | 0.0 | 1.0 | 0.0 | 0.0 | 2.0 | 0.0 | 0.0 | 2.0 | 1.0 | 9.0 | 6.0 |
| 2015 | 0.0 | 0.0 | 0.0 | 0.0 | 1.0 | 0.0 | 0.0 | 2.0 | 0.0 | 1.0 | 2.0 |
| 2014 | 0.0 | 0.0 | 0.0 | 0.0 | 2.0 | 0.0 | 0.0 | 0.0 | 0.0 | 3.0 | 0.0 |
| 2013 | 0.0 | 0.0 | 0.0 | 0.0 | 0.0 | 0.0 | 0.0 | 1.0 | 0.0 | 5.0 | 0.0 |
| 2012 | 1.0 | 0.0 | 0.0 | 0.0 | 0.0 | 0.0 | 0.0 | 0.0 | 0.0 | 1.0 | 1.0 |
| 2011 | 0.0 | 0.0 | 0.0 | 0.0 | 3.0 | 0.0 | 0.0 | 1.0 | 0.0 | 7.0 | 7.0 |
| 2010 | 0.0 | 0.0 | 1.0 | 0.0 | 0.0 | 0.0 | 0.0 | 1.0 | 0.0 | 0.0 | 1.0 |
| 2009 | 0.0 | 0.0 | 0.0 | 0.0 | 0.0 | 0.0 | 0.0 | 0.0 | 0.0 | 0.0 | 0.0 |
| 2008 | 0.0 | 0.0 | 0.0 | 0.0 | 1.0 | 0.0 | 0.0 | 1.0 | 0.0 | 0.0 | 0.0 |
| 2007 | 2.0 | 0.0 | 0.0 | 0.0 | 0.0 | 0.0 | 0.0 | 2.0 | 0.0 | 1.0 | 0.0 |
| 2006 | 0.0 | 0.0 | 0.0 | 0.0 | 2.0 | 0.0 | 0.0 | 1.0 | 0.0 | 2.0 | 5.0 |
| 2005 | 0.0 | 0.0 | 0.0 | 0.0 | 1.0 | 0.0 | 0.0 | 0.0 | 0.0 | 0.0 | 0.0 |
| 2004 | 1.0 | 0.0 | 0.0 | 0.0 | 0.0 | 0.0 | 0.0 | 0.0 | 0.0 | 1.0 | 0.0 |
| 2003 | 1.0 | 0.0 | 0.0 | 0.0 | 0.0 | 0.0 | 0.0 | 0.0 | 0.0 | 0.0 | 0.0 |
| 2002 | 0.0 | 0.0 | 0.0 | 0.0 | 0.0 | 0.0 | 0.0 | 0.0 | 0.0 | 0.0 | 0.0 |
| 2001 | 0.0 | 0.0 | 0.0 | 0.0 | 1.0 | 0.0 | 0.0 | 1.0 | 0.0 | 0.0 | 3.0 |
| 2000 | 0.0 | 0.0 | 0.0 | 0.0 | 0.0 | 0.0 | 0.0 | 0.0 | 0.0 | 1.0 | 0.0 |
| 1999 | 0.0 | 0.0 | 0.0 | 0.0 | 1.0 | 0.0 | 0.0 | 0.0 | 0.0 | 0.0 | 0.0 |
| 1998 | 0.0 | 0.0 | 0.0 | 0.0 | 0.0 | 0.0 | 0.0 | 0.0 | 0.0 | 0.0 | 0.0 |
| 1997 | 2.0 | 0.0 | 0.0 | 0.0 | 0.0 | 0.0 | 0.0 | 0.0 | 0.0 | 0.0 | 3.0 |
| 1996 | 0.0 | 0.0 | 0.0 | 0.0 | 0.0 | 0.0 | 0.0 | 1.0 | 0.0 | 0.0 | 0.0 |
| 1995 | 0.0 | 0.0 | 0.0 | 0.0 | 0.0 | 0.0 | 0.0 | 0.0 | 0.0 | 0.0 | 0.0 |
| 1994 | 0.0 | 0.0 | 0.0 | 0.0 | 1.0 | 0.0 | 0.0 | 0.0 | 0.0 | 0.0 | 0.0 |
| 1993 | 0.0 | 0.0 | 0.0 | 0.0 | 0.0 | 0.0 | 0.0 | 0.0 | 0.0 | 0.0 | 0.0 |
| 1992 | 0.0 | 0.0 | 0.0 | 0.0 | 0.0 | 0.0 | 0.0 | 0.0 | 0.0 | 0.0 | 0.0 |
| 1991 | 0.0 | 0.0 | 0.0 | 0.0 | 0.0 | 0.0 | 0.0 | 0.0 | 0.0 | 1.0 | 0.0 |
| 1990 | 0.0 | 0.0 | 0.0 | 0.0 | 0.0 | 0.0 | 0.0 | 0.0 | 1.0 | 1.0 | 0.0 |
| 1989 | 0.0 | 0.0 | 0.0 | 0.0 | 2.0 | 0.0 | 0.0 | 0.0 | 0.0 | 1.0 | 0.0 |
| 1988 | 0.0 | 0.0 | 0.0 | 0.0 | 0.0 | 0.0 | 0.0 | 1.0 | 0.0 | 0.0 | 0.0 |
| 1987 | 0.0 | 0.0 | 0.0 | 0.0 | 1.0 | 0.0 | 0.0 | 1.0 | 1.0 | 0.0 | 0.0 |
| 1986 | 0.0 | 0.0 | 0.0 | 0.0 | 0.0 | 0.0 | 0.0 | 0.0 | 0.0 | 0.0 | 0.0 |
| 1985 | 0.0 | 0.0 | 0.0 | 0.0 | 1.0 | 0.0 | 0.0 | 0.0 | 0.0 | 0.0 | 1.0 |
| 1984 | 0.0 | 0.0 | 0.0 | 0.0 | 0.0 | 0.0 | 0.0 | 0.0 | 0.0 | 0.0 | 0.0 |
| 1983 | 0.0 | 0.0 | 0.0 | 0.0 | 0.0 | 0.0 | 0.0 | 0.0 | 0.0 | 0.0 | 0.0 |
| 1982 | 0.0 | 0.0 | 0.0 | 0.0 | 0.0 | 0.0 | 0.0 | 0.0 | 0.0 | 0.0 | 0.0 |
Distribution map
Distribution - 2017
This map shows the observed distribution of the White-faced Heron for 2017.
The red circles are the grid cells where White-faced Heron have been reported.
The transparency of the red circles indicate how many surveys sheets were submitted for that grid cell; the darker the red the more reliable the data. Of the 315 grid cells with reports, 83 had only one sheet; an example is grid number A9.
The size of the circle represents the reporting rate. The maximum reporting rate for White-faced Heron was 100.0% (eg grid number A9) and the minimum was 0.3% (eg grid number K15). 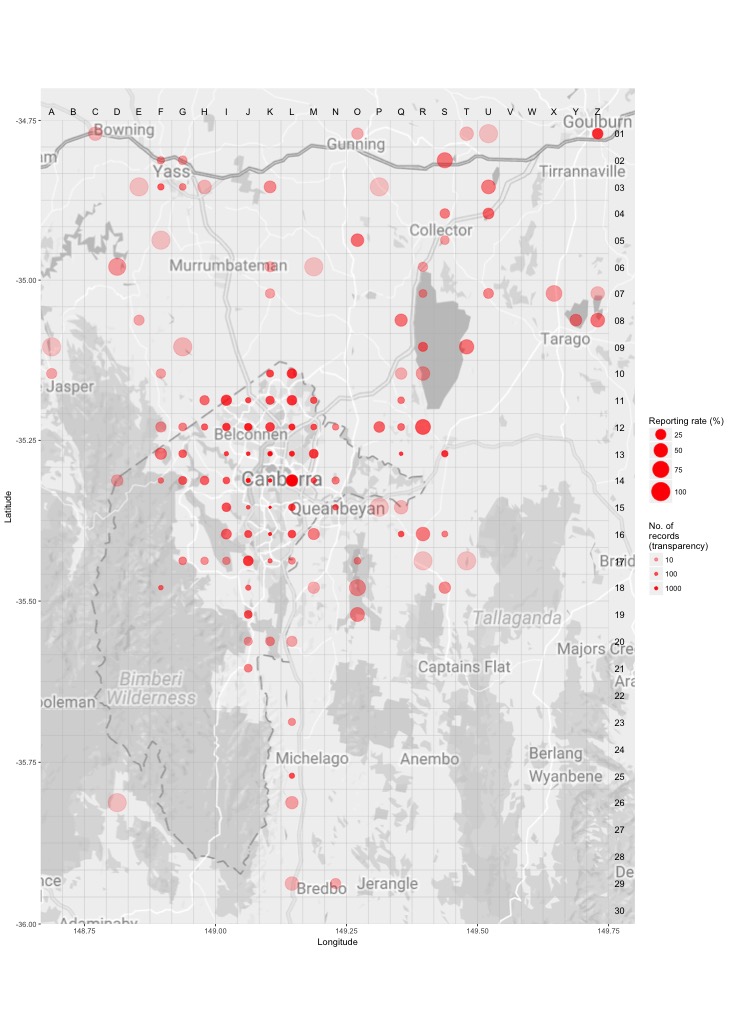
Distribution - all years
This map shows the observed distribution of the White-faced Heron for all years.
The red circles are the grid cells where White-faced Heron have been reported.
The transparency of the red circles indicate how many surveys sheets were submitted for that grid cell; the darker the red the more reliable the data. Of the 703 grid cells with reports, 55 had only one sheet; an example is grid number B5.
The size of the circle represents the reporting rate. The maximum reporting rate for White-faced Heron was 100.0% (eg grid number B5) and the minimum was 0.4% (eg grid number K15). 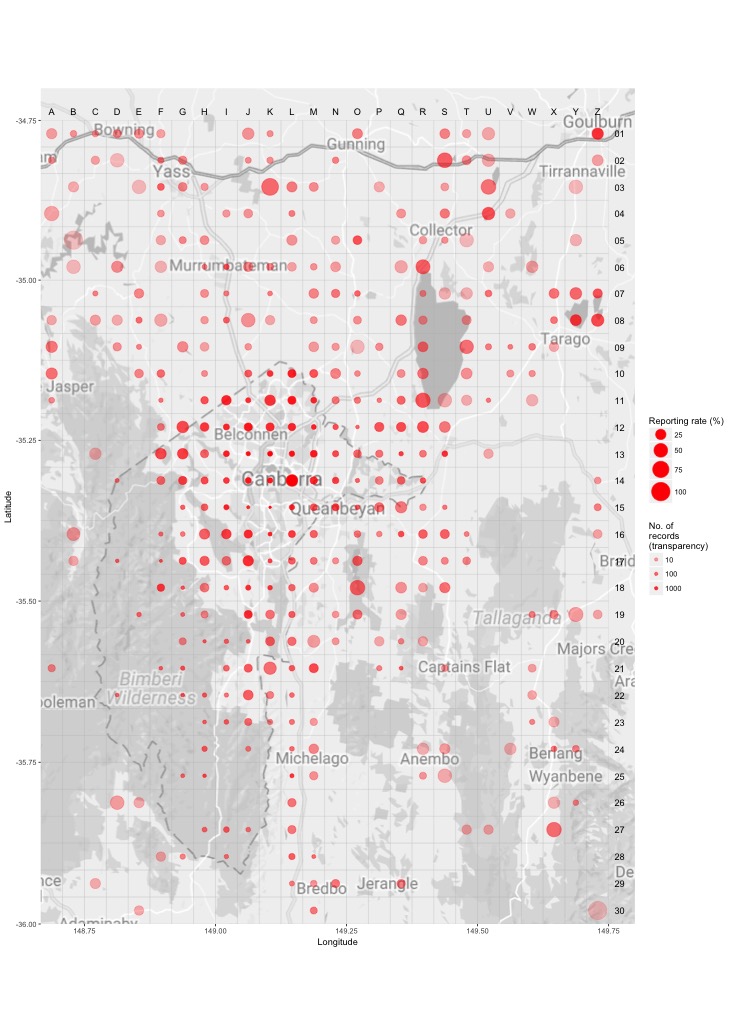
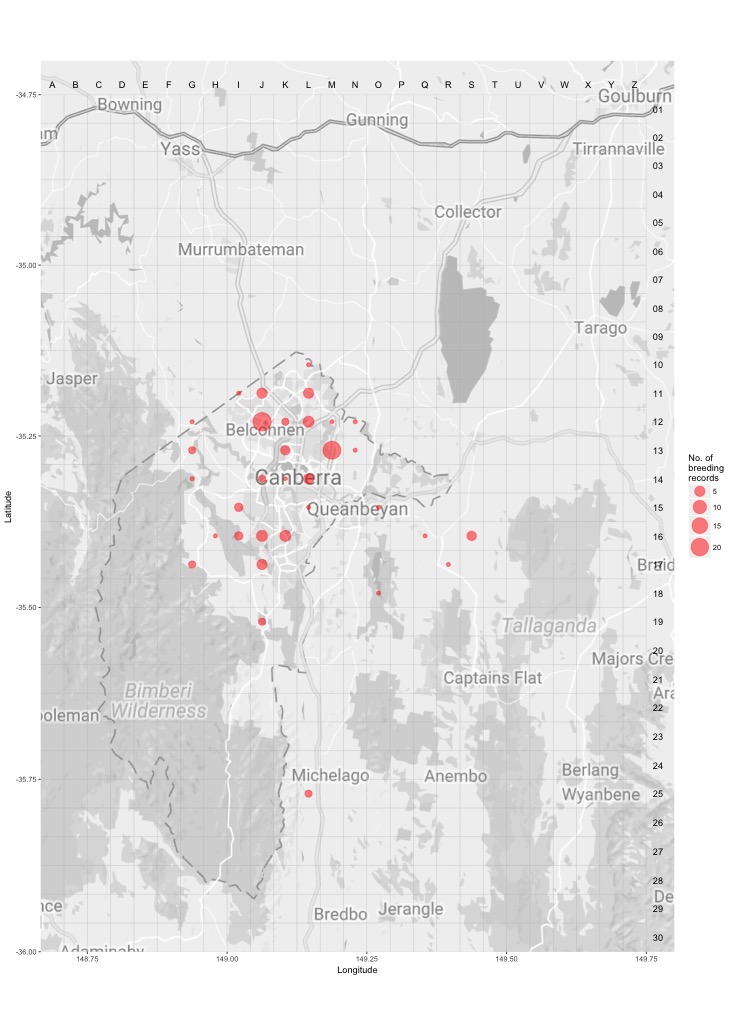
Breeding map
Breeding - 2017
This map shows the breeding distribution of the White-faced Heron for 2017.
The red circles are the grid cells where breeding activity for White-faced Heron have been reported.
The size of the circle represents the number of reports. 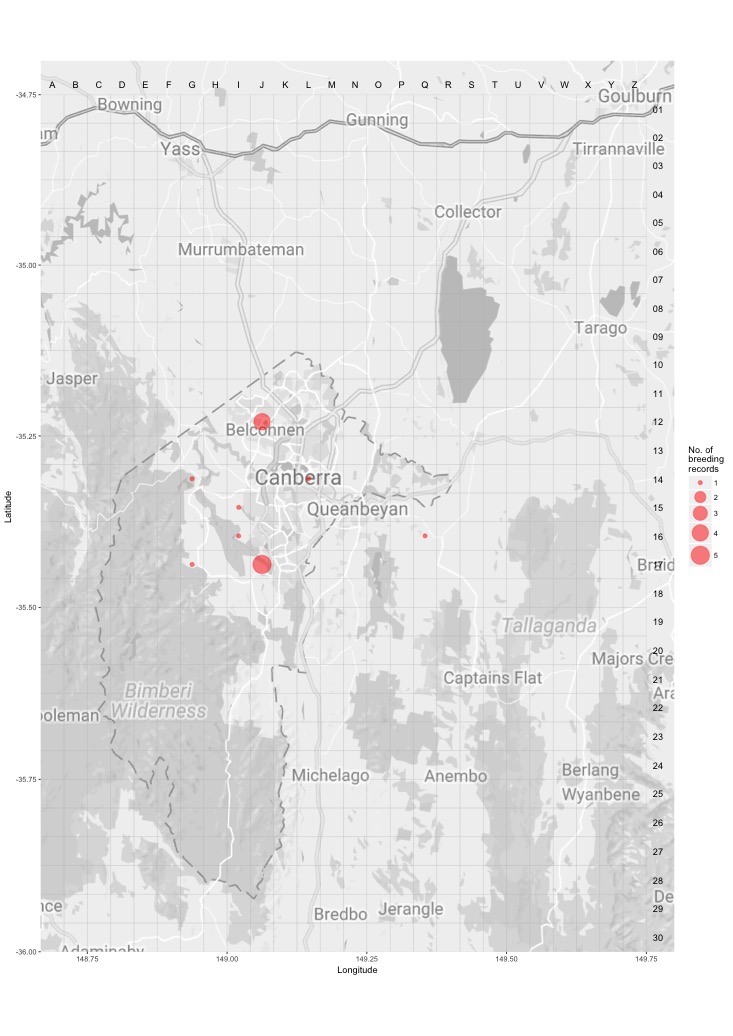
Breeding - all years
This map shows the breeding distribution of the White-faced Heron for all years.
The red circles are the grid cells where breeding activity for White-faced Heron have been reported.
The size of the circle represents the number of reports.